
PDF chapter test TRY NOW
Let us consider a bus travelling from Chennai to Trichy. The speed of the bus is measured for every second. The speed and time are recorded, and a graph is plotted using the data. The results for six possible journeys are shown below.
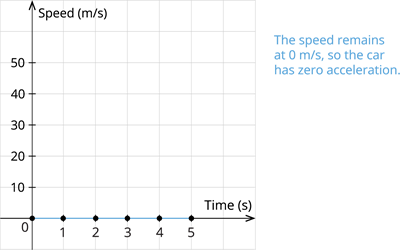
Case I: Bus at rest:
| Time(\(s\)) | \(0\) | \(1\) | \(2\) | \(3\) | \(4\) | \(5\) |
| Speed(\(m/s\)) | \(0\) | \(0\) | \(0\) | \(0\) | \(0\) | \(0\) |
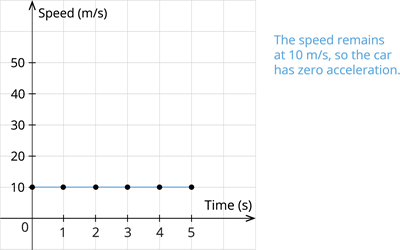
Case II: Bus travelling at uniform speed:
| Time(\(s\)) | \(0\) | \(1\) | \(2\) | \(3\) | \(4\) | \(5\) |
| Speed(\(m/s\)) | \(10\) | \(10\) | \(10\) | \(10\) | \(10\) | \(10\) |
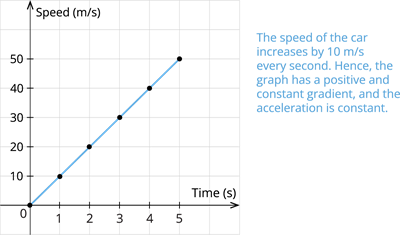
Case III: Bus travelling at uniform acceleration:
| Time(\(s\)) | \(0\) | \(1\) | \(2\) | \(3\) | \(4\) | \(5\) |
| Speed(\(m/s\)) | \(0\) | \(10\) | \(20\) | \(30\) | \(40\) | \(50\) |
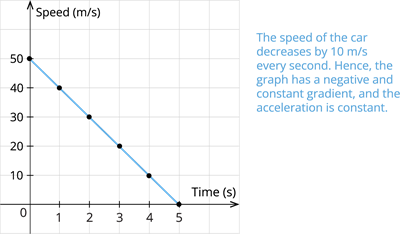
Case IV: Bus travelling at uniform deceleration:
| Time(\(s\)) | \(0\) | \(1\) | \(2\) | \(3\) | \(4\) | \(5\) |
| Speed(\(m/s\)) | \(50\) | \(40\) | \(30\) | \(20\) | \(10\) | \(0\) |
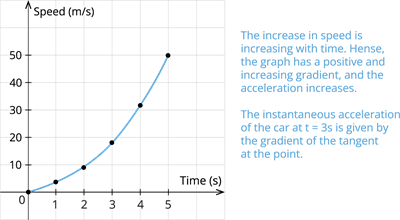
Case V: Bus travelling with increasing acceleration:
| Time(\(s\)) | \(0\) | \(1\) | \(2\) | \(3\) | \(4\) | \(5\) |
| Speed(\(m/s\)) | \(0\) | \(2\) | \(8\) | \(18\) | \(32\) | \(50\) |
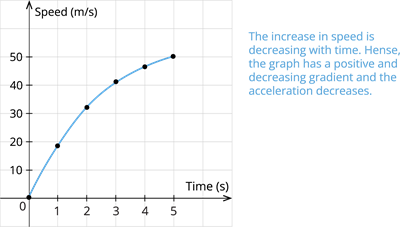
Case VI: Bus travelling with increasing deceleration:
| Time(\(s\)) | \(0\) | \(1\) | \(2\) | \(3\) | \(4\) | \(5\) |
| Speed(\(m/s\)) | \(0\) | \(18\) | \(32\) | \(42\) | \(48\) | \(50\) |
 Register for free to see more content