
PUMPA - SMART LEARNING
எங்கள் ஆசிரியர்களுடன் 1-ஆன்-1 ஆலோசனை நேரத்தைப் பெறுங்கள். டாப்பர் ஆவதற்கு நாங்கள் பயிற்சி அளிப்போம்
Book Free DemoThe following bar graph shows the number of books sold by a publisher during the five consecutive years. Read the bar graph and answer the following questions.
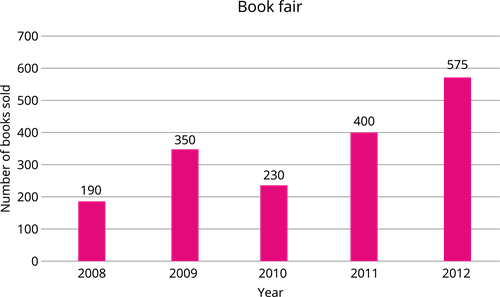
(i) How many books were sold in \(2008\), \(2009\) and \(2012\) years?
(ii) In which year \(230\) books sold?
(iii) In which year the minimum number of books sold?
 Register for free to see more content