
PUMPA - SMART LEARNING
எங்கள் ஆசிரியர்களுடன் 1-ஆன்-1 ஆலோசனை நேரத்தைப் பெறுங்கள். டாப்பர் ஆவதற்கு நாங்கள் பயிற்சி அளிப்போம்
Book Free DemoHistograms are one way of graphically representing a grouped data or continuous data.
Histograms are made of a set of rectangles. The \(X\)-axis will have the different ranges of continuous data, and \(Y\)-axis will have the frequency.
Let us learn how to draw histograms.
Click here to see how to draw a histogram if the class intervals are equal.
Now, we shall see how to draw a histogram if the class intervals are not equal.
Example:
Draw a histogram for the below given data:
| Number of trees | Height(in m) |
| \(25 - 30\) | \(12\) |
\(30 - 40\) | \(20\) |
| \(40 - 60\) | \(30\) |
| \(60 - 65\) | \(10\) |
| \(65 - 70\) | \(29\) |
| \(70 - 75\) | \(16\) |
| \(75 - 80\) | \(24\) |
Solution:
Step \(1\): Since the class intervals are not equal, let us select the with minimum class size. From the given, \(25 - 30\) has the minimum class size, which is \(5\).
Step \(2\): Let us modify all the class intervals having the class size as \(5\).
For example: Consider the interval \(30 - 40\) having class size \(10\) and frequency \(20\). When the class size is changed to \(5\), then the new frequency will be \(\frac{20}{10} \times 5 = 10\)
Step \(3\): Let us form the new frequency table.
| Number of trees | Height (in m)(frequency) | Class size | New frequency(in m) |
| \(25 - 30\) | \(12\) | \(5\) | \(\frac{12}{5} \times 5 = 12\) |
| \(30 - 40\) | \(20\) | \(10\) | \(\frac{20}{10} \times 5 = 10\) |
| \(40 - 60\) | \(30\) | \(20\) | \(\frac{30}{20} \times 5 = 7.5\) |
| \(60 - 65\) | \(10\) | \(5\) | \(\frac{10}{5} \times 5 = 10\) |
| \(65 - 70\) | \(29\) | \(5\) | \(\frac{29}{5} \times 5 = 29\) |
| \(70 - 75\) | \(16\) | \(5\) | \(\frac{16}{5} \times 5 = 16\) |
| \(75 - 80\) | \(24\) | \(5\) | \(\frac{24}{5} \times 5 = 24\) |
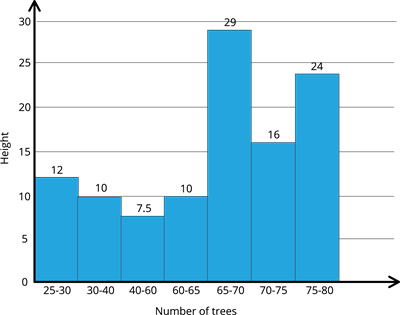
Step \(4\): Now, we shall draw the histogram for the above data.
 Register for free to see more content