
PDF chapter test TRY NOW
Graph is a method of visually showing the relationship between the numbers. We know how to plot points in a number line(horizontal line).

Now, for graph sheet, let us take one vertical line.
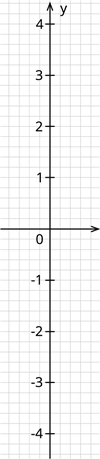
For graph sheet, let us take these two lines keeping them perpendicular to each other. These two lines intersect each other at the point \((0,0)\). These lines must be placed on the dark lines of the graph sheet.
Thus, the graph looks like:
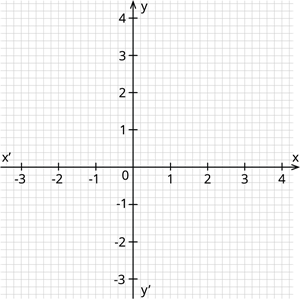
Here, the point \(0\) represent the intersection of the two lines, which is at the origin \((0,0)\).
 Register for free to see more content