PUMPA - SMART LEARNING
எங்கள் ஆசிரியர்களுடன் 1-ஆன்-1 ஆலோசனை நேரத்தைப் பெறுங்கள். டாப்பர் ஆவதற்கு நாங்கள் பயிற்சி அளிப்போம்
Book Free DemoWe know that histograms are created on continuous data.
Let us consider the data table given below and try to construct a histogram step-by-step.
Problem:
A private organization conducted a survey across hundred schools in Chennai. The organization collected the average number of kindergarten children in each classroom.
The data table looks like this:
Number of students | \(25\) - \(30\) | \(30\) - \(35\) | \(35\) - \(40\) | \(40\) - \(45\) | \(45\) - \(50\) |
Frequency | \(15\) | \(35\) | \(18\) | \(25\) | \(7\) |
Now, let us try to construct a histogram.
Step \(1\): Convert the data received into continuous data.
Here, the data is already in continuous form. Hence, no conversion is required.
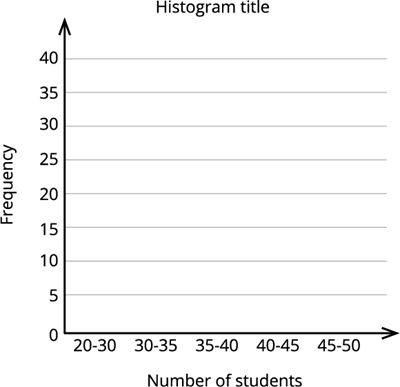
Step \(2\): Select appropriate names and units for \(X\)-axis and \(Y\)-axis.
Here, the axes will look like this:

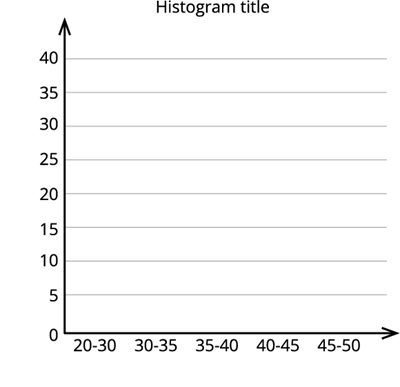
Step \(3\): Now mark the class intervals along the \(X\)-axis, and the frequency along the \(Y\)-axis.

Step \(4\): Now, construct rectangles with class intervals as the base, and the frequency as the height.
