
PDF chapter test TRY NOW
Observe the following bar graph and answer the following based on the data provided:
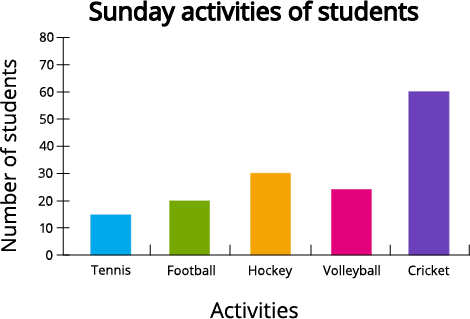
1. Which activity is maximum preferred? .
2. The number of students who preferred tennis as Sunday activity is .
3. The total number of students who preferred tennis and cricket is .
4. What is the difference in the number of students preferred cricket and tennis? .
 Register for free to see more content