
PUMPA - SMART LEARNING
எங்கள் ஆசிரியர்களுடன் 1-ஆன்-1 ஆலோசனை நேரத்தைப் பெறுங்கள். டாப்பர் ஆவதற்கு நாங்கள் பயிற்சி அளிப்போம்
Book Free DemoThe experiment requires four cells of \(1.5\ V\), \(0.5\ m\) coil of nichrome wire, key, ammeter, and voltmeter.
Nichrome is an alloy of nickel, chromium, manganese, and iron metals.
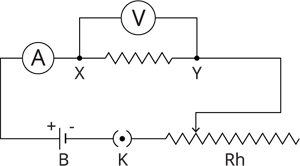
Experimental set-up
- Connect the cell, nichrome wire, ammeter and key in series, and the voltmeter parallel to the circuit.
- First, connect only one cell in the circuit.
- Note down the current value in the ammeter and the potential difference across the nichrome wire \(XY\) in the voltmeter.
- Now, connect two cells in the circuit.
- Note down the current value in the ammeter and the potential difference across the nichrome wire \(XY\) in the voltmeter.
- Again, connect three cells in the circuit and note the current and the potential difference.
- Repeat the same steps using four cells in the circuit.
- Tabulate the values of current (\(I\)) and the potential difference (\(V\)) as shown in the table.
S.No | No. of cells used in the circuit | Current (\(I\)) through the nichrome wire (\(ampere\)) | Potential difference (\(V\)) across the nichrome wire (\(volt\)) | Resistance\(=\) \(\frac {V}{I}\) (Ohm) |
1. | 1 | |||
2. | 2 | |||
3. | 3 | |||
4. | 4 |
Graphical representation:
From the values obtained, it is observed that the values of \(\frac {V}{I}\) are the same. The graph between the potential difference (\(V\)) and the current (\(I\)) is a straight-line for a conductor since \(V\) is proportional to \(I\). The line proves that \(\frac {V}{I}\) is a constant ratio.
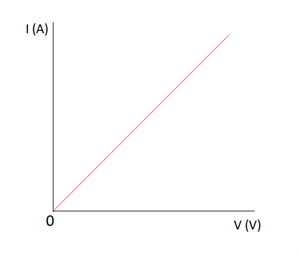
The relation between potential difference and current
The straight-line shows that as the current through a metallic wire increases, the potential difference across the wire also increases linearly.
 Register for free to see more content