
PDF chapter test TRY NOW
Two students were asked to plot a distance-time graph for the motion described by Table \(A\) and Table \(B\).
Table \(A\):
| Distance moved (m) | 0 | 10 | 20 | 30 | 40 | 50 |
| Time (minutes) | 0 | 2 | 4 | 6 | 8 | 10 |
Table \(B\):
| Distance moved (m) | 0 | 5 | 10 | 15 | 20 | 25 |
| Time (minutes) | 0 | 1 | 2 | 3 | 4 | 5 |
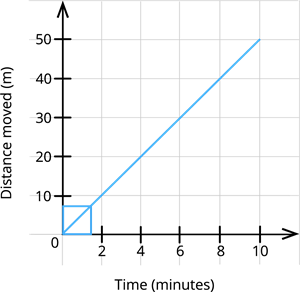
Distance-time graph
The graph given in figure is true for
 Register for free to see more content