


PDF chapter test TRY NOW
Solve the following questions.
Represent the data graphically by plotting the tree age, stem diameter, and number of annual rings.
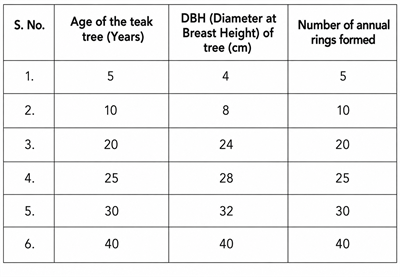
Data related to the age of a teak tree, and corresponding increase in the diameter of stem and number of annual rings
Analyse the graph in terms of the diameter of the stem over time and share the interpretation.
The graph shows that the diameter of the teak tree as the age of the tree . This indicates of the stem over time due to . Older trees have thicker stems and annual rings.
 Register for free to see more content