
PUMPA - SMART LEARNING
எங்கள் ஆசிரியர்களுடன் 1-ஆன்-1 ஆலோசனை நேரத்தைப் பெறுங்கள். டாப்பர் ஆவதற்கு நாங்கள் பயிற்சி அளிப்போம்
Book Free DemoWhich of the above two graphs (a) and (b) (Fig.) representing the human voice is likely to be the male voice? Give the reason for your answer.
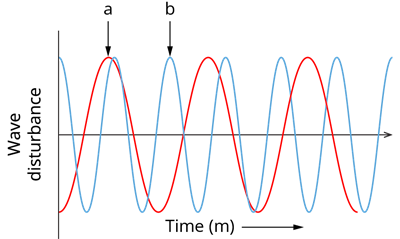
Generally the male voice has as compared to female voice.
As the time period of wave represented by graph (a) is that of graph (b). So, graph (a) represents wave than graph (b).
Hence, is likely to be the male voice.
 Register for free to see more content