
PDF chapter test TRY NOW
Speed – time graphs:
Let us consider you're going for a vacation with your family in a car from Chennai to Ooty.
The speed of the car is measured for every second. The speed and time are recorded, and a graph is plotted using the data.
The results for four possible journeys are shown below.
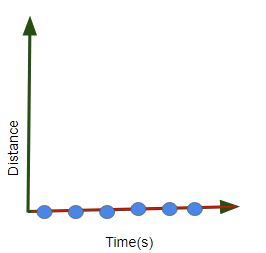
Case I) If the car at rest, then the speed will be zero all the time.
Case II) Car travelling with uniform acceleration.
| Speed (m/s) | \(0\) | \(5\) | \(10\) | \(15\) | \(20\) | \(25\) |
| Time(s) | \(0\) | \(1\) | \(2\) | \(3\) | \(4\) | \(5\) |
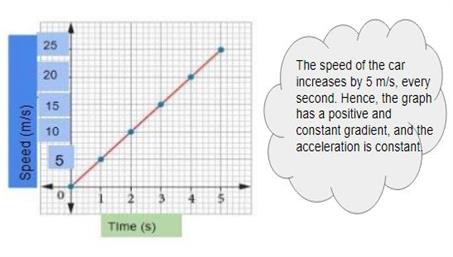
From the above graph, we can know that the car moves \(5\) metres for each second.
Case III) Car travelling with increasing acceleration.
The below data shows travelling with increasing acceleration in a non-uniform acceleration.
| Time(s) | \(0\) | \(1\) | \(2\) | \(3\) | \(4\) | \(5\) |
| Speed (m/s) | \(0\) | \(2\) | \(8\) | \(18\) | \(32\) | \(50\) |
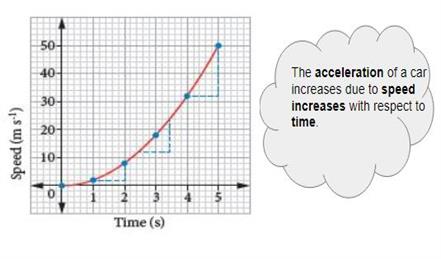
From the above graph, we can know that the car moves with increasing acceleration.
Case IV) Car travelling with decreasing acceleration.
The below data shows travelling with decreasing acceleration in a non-uniform acceleration.
| Time(s) | \(0\) | \(1\) | \(2\) | \(3\) | \(4\) | \(5\) |
| Speed (m/s) | \(0\) | \(19\) | \(31\) | \(41\) | \(48\) | \(50\) |
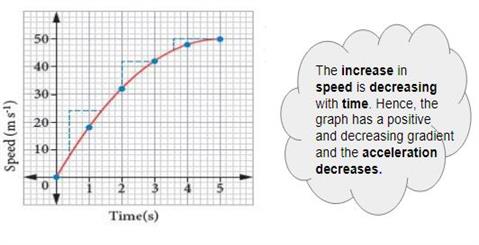
From the above graph, we can know that the car moves with decreasing acceleration.
Reference:
Reference:
Tamil Nadu text book 7th std science - https://drive.google.com/file/d/1-_TOLPPHJVDUKb67V5dqzy8vW422bgGk/view
 Register for free to see more content