
PDF chapter test TRY NOW
Time – Distance Graphs:
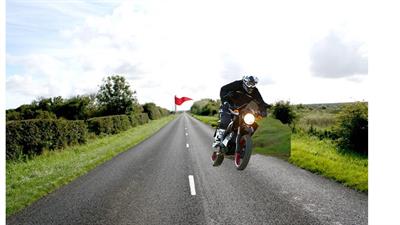
The above figure shows a bike travelling along a straight line away from the starting point (red colour flag) with uniform speed.
The distance of the bike is measured for every second. The distance and time are recorded, and a graph is plotted using the data. The below graph shows the possible results of journeys.
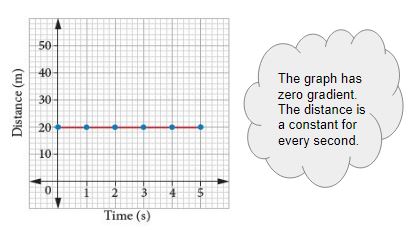
Case I) If the bike is staying at rest, then the distance is constant for every second.
If we plot a graph for the constant distance, we get,
Case II) The bike travelling at a uniform speed of \(5\) m/s.
| Distances(m) | \(0\) | \(5\) | \(10\) | \(15\) | \(20\) | \(25\) |
| Time(s) | \(0\) | \(1\) | \(2\) | \(3\) | \(4\) | \(5\) |
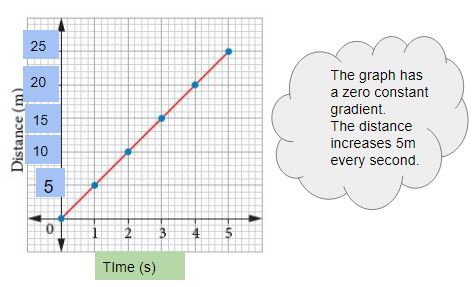
From the above graph, we can know that for each second, the bike moving \(5\) metres.
Similarly, we can graph the distance travelled by any vehicle/ object with respect to time.
Reference:
Tamil Nadu text book 7th std science: https://drive.google.com/file/d/1-_TOLPPHJVDUKb67V5dqzy8vW422bgGk/view
 Register for free to see more content