
UPSKILL MATH PLUS
Learn Mathematics through our AI based learning portal with the support of our Academic Experts!
Learn moreA double bar graph is one of the types of the grouped bar graph.
A double bar graph is used to compare two types of data simultaneously. It helps to present more than one kind of information at the same time. Both bars are coloured or shaded differently to differentiate between bars for each form of data.
The information in a double bar graph is related, and it compares one set of data to another.
A double bar graph is made in the same way that a simple bar graph is made, except that instead of one bar of data, there will be two bars of data.
Here are the steps to draw the double bar graph:
- Draw two axes with one horizontal and the other vertical.
- Given items are marked on the \(x\)-axis, and the scale is marked on the \(y\)-axis.
- Decide on the best scale to use the given data.
- Draw the bars to show the data.
- Draw one category in one colour and the other category in another colour.
- Give a suitable title and axes names.
Example:
Let us consider a particular class in school. The teacher surveyed boys and girls on their preference for the movie.
Here comes the tabulated form of the result.
Gender / Type of movie | Action | Comedy | Drama | Science fiction |
Girls | \(6\) | \(18\) | \(12\) | \(15\) |
Boys | \(15\) | \(16\) | \(8\) | \(11\) |
Let's follow the steps and draw the bar graph for the given data.
Step 1: Draw two perpendicular lines. One is horizontally for movies like action, comedy, drama and science fiction, with two bars in each type for girls and boys. The other will be vertically for the number of people in it.
Step 2: The horizontal line will take the movie type with equal spaces between them, and the vertical line takes the number of people from \(0\) to \(20\) (as the maximum number is \(18\)) with \(2\) point difference in each step (like \(0\), \(2\), \(4\), \(6\), ...., \(20\)).
Step 3: Mark signs of equal breadth for each class and leave equal or not less than half a breadth between two classes.
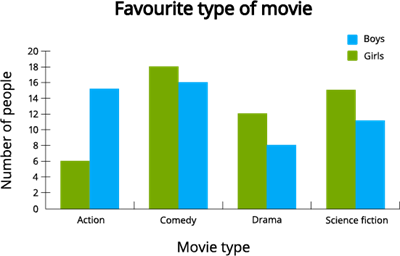
Step 4: Now, mark the values \(6\) and \(15\) for girls and boys in action movies. Then, mark \(18\) and \(16\) for girls and boys in comedy and proceed in the same way for remaining values.
Step 5: Write the title as 'Favourite type of movie' and the axes label as 'Movie types' along the \(x\)-axis and 'Number of people' along the \(y\)-axis. Also, shade the bars with different colours to differentiate the variables, girls and boys.
Representation of the double bar graph will be like as follows:
 Register for free to see more content