
PUMPA - SMART LEARNING
எங்கள் ஆசிரியர்களுடன் 1-ஆன்-1 ஆலோசனை நேரத்தைப் பெறுங்கள். டாப்பர் ஆவதற்கு நாங்கள் பயிற்சி அளிப்போம்
Book Free DemoRemember the following points while choosing a scale for the bar graph.
1. The lengths of the bar depend upon the frequency and the scale chosen.
2. The width of each bar is the same.
3. The space between any two bars is also the same.
Generally, in a bar graph, one unit length represents one observation, and if it has to show numbers in tens or hundreds, one unit length can represent \(10\) or \(100\) observations.
Example:
Let us see a scale of the simple bar graph.

The scale in the above graph:
One unit length represents \(10\) people
Types of bar graph
Simple bar graph:
Important!
We already learned simple bar graph in previous classes. To learn more about simple bar graph, click here.
Grouped bar graph:
It is used to represent and compare different categories of two or more groups. We know that a simple bar graph helps compare the observations of one set of data. Suppose we have more than one (two, three, four, etc.) set of data and want to distinguish each type of data; we can use this grouped bar graph.
Example:
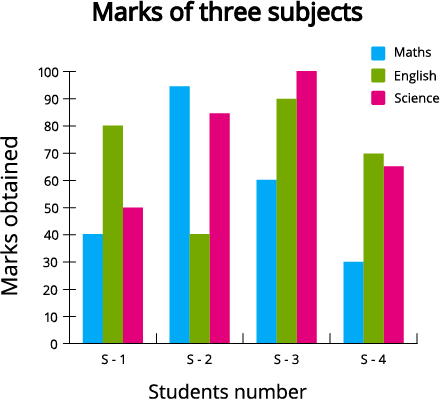
Let's see a grouped bar graph of three bars. There are four different students with their marks in three different subjects (Maths, English, and Science).
 Register for free to see more content