
PUMPA - SMART LEARNING
எங்கள் ஆசிரியர்களுடன் 1-ஆன்-1 ஆலோசனை நேரத்தைப் பெறுங்கள். டாப்பர் ஆவதற்கு நாங்கள் பயிற்சி அளிப்போம்
Book Free DemoTree diagram is a visual representation of the all the possible outcomes of the random experiment. Each branch in a tree diagram represent a possible outcome.
Let's toss a coin. The possible outcomes of this experiment is two, which is either Tails or Head.
We can make tree diagram of this experiment as given below.
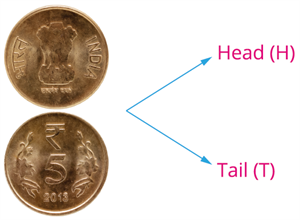
So, the sample space for this experiment will be \( S = {H, T}\).
In this case, if we toss two coins the tree diagram and sample space will be:
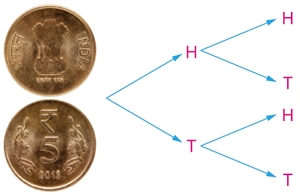
The sample space for tossing two coins \( S = {HH, HT, TH, TT}\).
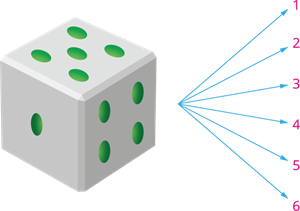
Similarly, When we throw a die, there are \(6\) possible outcomes. We can make a tree diagram for this as well.
In this chapter, let's practice some concepts by using the tree diagram.
 Register for free to see more content