
PUMPA - SMART LEARNING
எங்கள் ஆசிரியர்களுடன் 1-ஆன்-1 ஆலோசனை நேரத்தைப் பெறுங்கள். டாப்பர் ஆவதற்கு நாங்கள் பயிற்சி அளிப்போம்
Book Free DemoThe folloing bar graph shows the profit (\(+\)) and loss (\(-\)) of a small scale company (in crores) between the years \(2011\) to \(2017\).
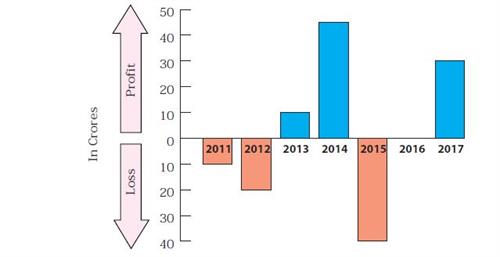
1. Write the integer that represents a profit or a loss for the company in \(2014\)?
2. Denote by an integer on the profit or loss in \(2016\).
3. Denote by integers on the loss for the company in \(2011\) and \(2012\).
The loss for the company \(2011\) is crore.
The loss for the company \(2012\) is crore.
4. Say True or False: The loss is minimum in \(2012\).
5. Fill in: The amount of loss in \(2011\) is as profit in \(2013\).
 Register for free to see more content