
UPSKILL MATH PLUS
Learn Mathematics through our AI based learning portal with the support of our Academic Experts!
Learn moreIn the Pictograph, the data is represented using the pictures. Pictograph plays a vital role while representing a data because only through the numbers and tally marks, we cannot represent all the different data. Using this method, we represent numerous data in a simple way.
We see an example which could help us understand the 'Pictograph'.
The below table shows the single-day sale data in the fruits shop. The vendor sold a \(30\) Apples, \(25\) Guava fruits, \(20\) Pomegranates, and \(15\) Bananas.
In the following pictography, one full picture of fruit represents \(10\) fruits, and one-half picture represents \(5\) fruits.
Name of the fruits | Number of fruits tally mark | Number of fruits in pictography |
Apples | \(30 =\) | 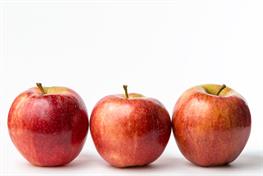 |
Guava | \(25 =\) | 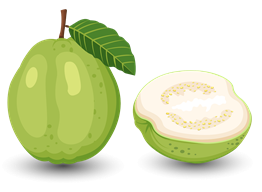 |
Pomegranates | \(20 =\) | 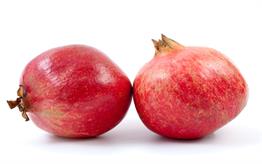 |
Bananas | \(15 =\) |  |
If you notice the above table, the pictography is much easy to understand visually than the tally mark. This is why pictographs are widely used to represent data in statistics.
Interpretation of pictograph:
From the above pictograph, we can derive the number of fruits sold in a fruit shop.
1. The number of apples sold \(=\) \(3\) full pictures that means \(3 × 10 = 30\).
2. The number of guava sold \(=\) \(2\) full pictures and \(1\) half picture that means \(2 × 10 + 1 ×5 = 25\).
3. The number of Pomegranates sold \(=\) \(2\) full pictures that means \(2 × 10 = 20\).
4. The number of banana sold \(=\) \(1\) full pictures and \(1\) half picture, which means \(1 × 10 + 1 × 5 = 15\).
Advantages:
Pictograph is a unique and effective way of representing the data.
The pictures gives a simple visual experience to the data presented.
Easily analyzable and understandable.
 Register for free to see more content