
PDF chapter test TRY NOW
The bar graph illustrates the results of a survey conducted on vehicles crossing over a Toll Plaza in one hour.
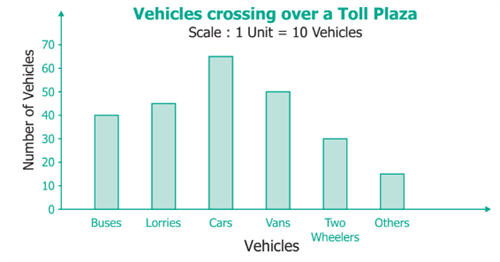
Observe the bar graph carefully and fill up the following table.
| Vehicles | Buses | Cars | Vans | Others | Total vehicles | ||
| Number of vehicles | \(45\) | \(30\) |
 Register for free to see more content