
PDF chapter test TRY NOW
Read the given bar graph which shows the percentage of marks obtained by Brinda in different subjects in an assessment test.
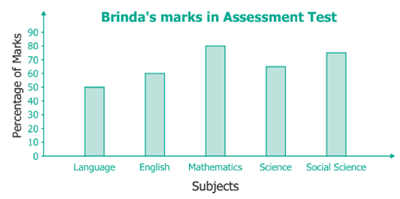
Observe the bar graph and answer the following questions.
(i) \(1 \ unit =\) \(\%\) of marks on the vertical line.
(ii) Brinda has scored maximum marks in subject.
(iii) Brinda has scored minimum marks in subject.
(iv) The percentage of marks scored by Brinda in Science is .
(v) Brinda scored \(60 \%\) marks in the subject .
(vi) Brinda scored \(20 \%\) more in subject than subject.
 Register for free to see more content