
UPSKILL MATH PLUS
Learn Mathematics through our AI based learning portal with the support of our Academic Experts!
Learn moreObserve the following bar graph and answer the following based on the data provided:
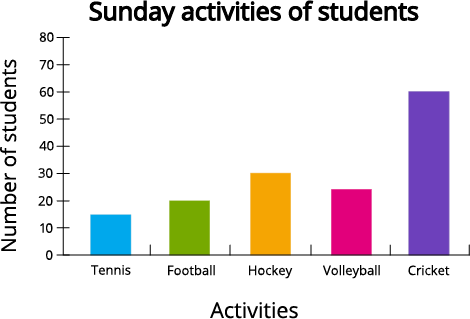
1. Which activity is maximum preferred? .
2. The number of students who preferred tennis as sunday activity is .
3. The total number of students who preferred football and volleyball is .
4. What is the difference in the number of students preferred cricket and football ?.
 Register for free to see more content