
PDF chapter test TRY NOW
An equation in which two variables are involved and having its highest power as one is called as linear equation in two variables.
Let us discuss how to draw the graph of a linear equation in two variables.
Example:
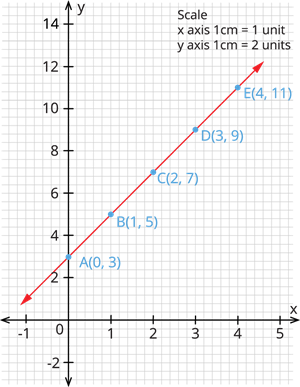
1. Draw the graph for the equation \(y = 2x + 3\).
Solution:
To plot the graph, we need the coordinates of \(x\) and \(y\).
Let us substitute values for \(x\) and find the value of \(y\).
When \(x = 0\), \(y = 2(0) + 3\) \(= 3\).
When \(x = 1\), \(y = 2(1) + 3\) \(= 5\).
When \(x = 2\), \(y = 2(2) + 3\) \(= 7\).
When \(x = 3\), \(y = 2(3) + 3\) \(= 9\).
When \(x = 4\), \(y = 2(4) + 3\) \(= 11\).
Now, tabulating the values, we have:
| \(x\) | \(0\) | \(1\) | \(2\) | \(3\) | \(4\) |
| \(y\) | \(3\) | \(5\) | \(7\) | \(9\) | \(11\) |
Now, plotting these points in the graph, we get:
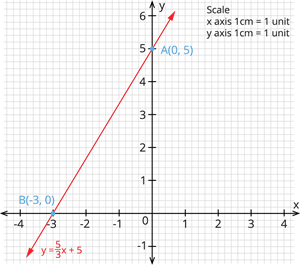
2. Graph the equation \(y = \frac{5}{3}x + 5\).
Solution:
To plot the graph, we need the coordinates of \(x\) and \(y\).
Let us neglect the fractional answers for easy graphing.
Put \(x = 0\) in the equation, we have:
\(y = \frac{5}{3}(0) + 5\)
\(y = 5\)
Similarly, substitute \(y = 0\) in the equation, we have:
\(0 = \frac{5}{3}x + 5\)
\(-5 = \frac{5}{3}x\)
\(-5 \times \frac{3}{5} = x\)
\(-3 = x\)
Thus, let us plot the obtained coordinates \((0,5)\) and \((-3,0)\) in the graph.
Applications:
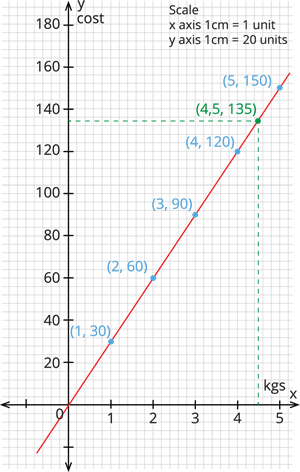
If the cost of \(1 \ kg\) of tomato is \(₹30\) then, find the cost \(4.5 \ kgs\) of tomato and also draw the graph.
Solution:
Given that the cost of \(1 \ kg\) of tomato is \(₹30\).
That is \(1 \ kg\) \(= ₹30\).
\(2 \ kg\) \(= 2 \times 30\) \(= ₹60\).
\(3 \ kg\) \(= 3 \times 30\) \(= ₹90\).
\(4 \ kg\) \(= 4 \times 30\) \(= ₹120\).
\(5 \ kg\) \(= 5 \times 30\) \(= ₹150\).
Now, let us plot the graph.
Step \(1\): Mark the \(x\) - axis as the number of \(kgs\).
Step \(2\): Mark the \(y\) - axis as cost.
Step \(3\): Plot the coordinates \((1,30)\), \((2,60)\), \((3,90)\), \((4,120)\) and \((5,150)\).
Step \(4\): Join the points.
Step \(5\): From the graph, we can see that the cost of \(4.5 \ kgs\) of tomato is \(₹135\).
 Register for free to see more content