
PDF chapter test TRY NOW
Consider plotting the points \((0,4)\), \((1,5)\), \((2,6)\), \((3,7)\) and \((4,8)\) in the graph.
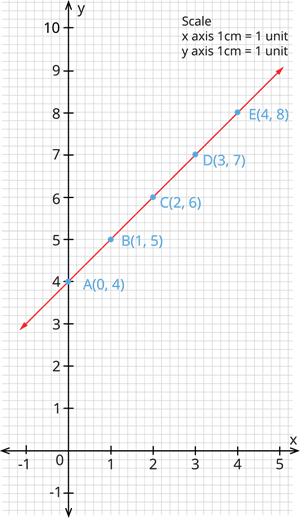
From the graph, we can see that all these points lie on a line and also, there is a pattern in the coordinates.
Consider the \(y\) - coordinate in every pair.
(I) \(4 = 0 + 4\)
(II) \(5 = 1 + 4\)
(III) \(6 = 2 + 4\)
(IV) \(7 = 3 + 4\)
(V) \(8 = 4 + 4\)
If all the points lie on the line, it is called as "a linear pattern".
In every pair, we can see that, the \(y\) - coordinate is \(4\) more than the \(x\) - coordinate.
Also, we can write that \(y\) - value \(=\) \(x\) - value \(+ 4\)
That is, \(y = x + 4\).
This equation is called a linear equation, and the graph of the linear equation is called a linear graph.
In a linear equation there can be one or more variables where one variable is dependent on the other.
Example:
Let us consider if we buy \(1 \ kg\) of tomato for \(₹25\). If we buy more \(kgs\) of tomato, the more we have to pay to buy.
Hence, if the quantity of tomato increases, then its cost also increases with it. Here, tomato is the independent variable whereas the cost depends on the quantity of tomato we buy. Hence, cost is a dependent variable.
 Register for free to see more content