
PUMPA - SMART LEARNING
எங்கள் ஆசிரியர்களுடன் 1-ஆன்-1 ஆலோசனை நேரத்தைப் பெறுங்கள். டாப்பர் ஆவதற்கு நாங்கள் பயிற்சி அளிப்போம்
Book Free DemoIn the previous topics, we have seen how to plot the points \((1,5)\), \((-9, 10)\).
Is it possible to plot the points with much bigger values \((56, 78)\), \((89, 45)\)?
Yes, it is possible. In graph, while plotting the points there are some situations that may be the value of \(x\) is much big than \(y\) or the value of \(y\) is much bigger than \(x\). Thus, in these cases, let us use the concept of scale in the coordinate axes as per the requirement. And represent the measurement at the right side corner of the graph.
Scale is the measurement that have been taken for \(1\) unit in the graph.
Example:
1. Look at the graph and find the scale.
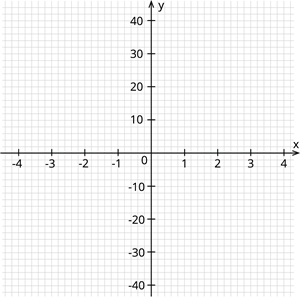
Solution:
In this graph, we can see that in the \(x\) - axis, the value increases by \(1\) per unit.
Hence, the scale of \(x\) - axis is \(1 \ cm =\) \(1 \ unit\).
In the \(y\) - axis, the value increases by \(10\) per unit.
The scale of \(y\) - axis is \(1 \ cm =\) \(10 \ units\).
2. Find the scale of the given graph.
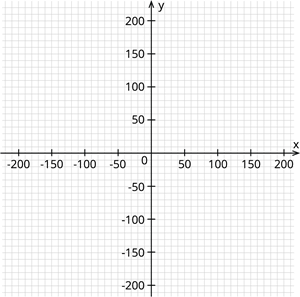
Solution:
In the \(x\) - axis, the value of \(x\) increases by \(50\) per unit.
Similarly, in the \(y\) - axis, the value of \(y\) increases by \(50\) per unit.
Therefore, the scale is given by:
\(x\) - axis \(1 \ cm =\) \(50 \ units\)
\(y\) - axis \(1 \ cm =\) \(50 \ units\)
 Register for free to see more content