PDF chapter test TRY NOW
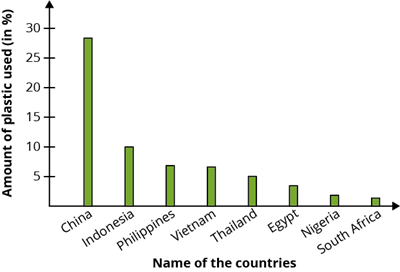
Read the following information and convert them into a graph to compare the countries and the amount of plastic they use.
China contributes the highest share - that is around \(28\)%, of the total plastic used globally. Indonesia uses \(10\)%, both the Philippines and Vietnam use \(6\)% each; Thailand uses \(3.2\)%, Egypt \(3\)%, Nigeria \(2.7\)% and South Africa \(2\)%.
Solution:

Important!
This is an experiment exercise. Write your answer in a white sheet and compare it with the solution.
