
PUMPA - SMART LEARNING
எங்கள் ஆசிரியர்களுடன் 1-ஆன்-1 ஆலோசனை நேரத்தைப் பெறுங்கள். டாப்பர் ஆவதற்கு நாங்கள் பயிற்சி அளிப்போம்
Book Free DemoLet us discuss how to identify the graphs of a quadratic function.
Quadratic function:
A function \(f: \mathbb{R} \rightarrow \mathbb{R}\) defined by \(f(x) = ax^2 + bx + c\), \(a \neq 0\) is called a quadratic function.
Let us further discuss some specific quadratic functions.
Specification 1:
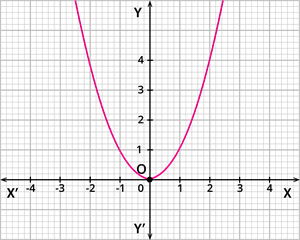
A quadratic function \(f: \mathbb{R} \rightarrow \mathbb{R}\) with domain \(x \in \mathbb{R}\) and range \(f(x) \in [0, \infty)\) is defined by \(f(x) = x^2\).
The graphical representation of this quadratic function is given by:
 |
Specification II:
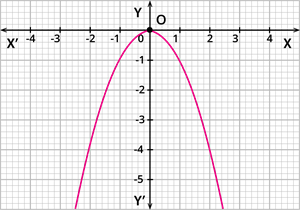
A function \(f: \mathbb{R} \rightarrow \mathbb{R}\) defined by \(f(x) = - x^2\) is a quadratic function with a domain \(x \in \mathbb{R}\) and a range \(f(x) \in (- \infty, 0]\).
The graphical representation of the quadratic function is given by:
 |
Important!
- The quadratic functions are not one-to-one functions.
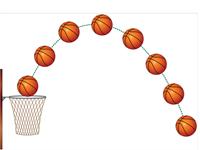
- The equation of motion of the particle travelling under the influence of gravity is an example of the quadratic function of time.
 Register for free to see more content