
PUMPA - SMART LEARNING
எங்கள் ஆசிரியர்களுடன் 1-ஆன்-1 ஆலோசனை நேரத்தைப் பெறுங்கள். டாப்பர் ஆவதற்கு நாங்கள் பயிற்சி அளிப்போம்
Book Free DemoGraphs are an efficient way of visualizing curves and functions.
Let us discuss how to identify the graphs of a linear function.
Linear function:
A function \(f: \mathbb{R} \rightarrow \mathbb{R}\) defined by \(f(x) = mx + c\), \(m \neq 0\) is called a linear function.
The graph of a linear function simply represents a straight line.
Let us further discuss some specific linear functions.
- Identity function
- Additive inverse function
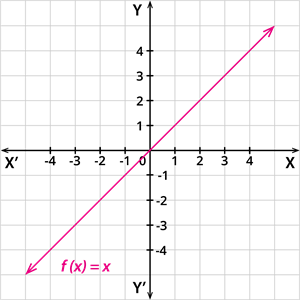
Identity function:
A function \(f: \mathbb{R} \rightarrow \mathbb{R}\) defined by \(f(x) = x\), is called an identity function.
In other words, a linear function having an intercept \(c = 0\) and a slope \(m = 1\) is called an identity function.
The graphical representation of the identity function is given by:
 |
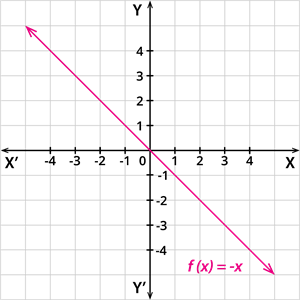
Additive inverse function:
A function \(f: \mathbb{R} \rightarrow \mathbb{R}\) defined by \(f(x) = - x\), is called an additive inverse function.
In other words, a linear function having an intercept \(c = 0\) and slope \(m = -1\) is called an additive inverse function.
The graphical representation of the identity function is given by:
 |
Important!
The linear functions are always one-to-one functions.
 Register for free to see more content